Understanding the Feature Space of an Image Captioning Model for Pokémon Cards
In this post, I extend a prior project that fine-tuned a vision-language model to caption Pokémon cards. My goal for this post is to fine-tune the vision-language model with the full 13K Pokémon cards dataset and subsequently understand the representation space of the vision component of the model. This understanding should allow me to pinpoint future extensions I should make to either the dataset, model or model training. Additionally, training on the full 13K dataset would provide me with a baseline that I can use for evaluating any future extensions. All code for this post can be found in the project’s repo.
Image Captioning Model & Training
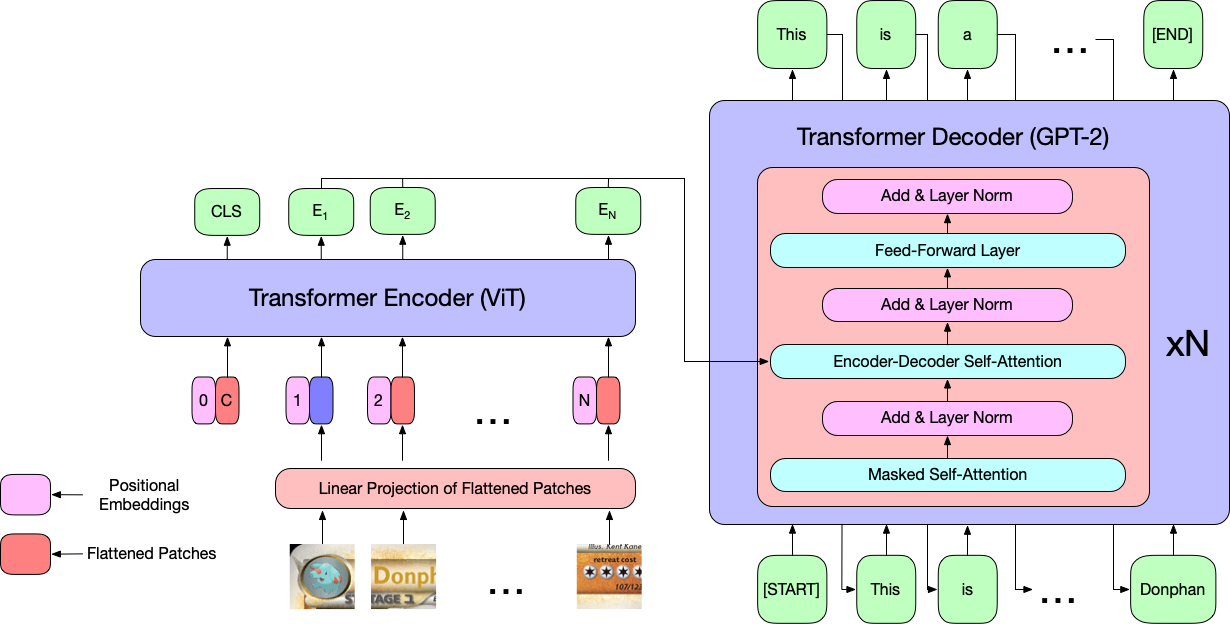
The model I used in the previous report is a pre-trained image-to-text model from HuggingFace which combines a Vision Transformer (ViT) encoder with a GPT-2 decoder. The Vision Transformer is a Transformer Encoder trained on image data while GPT-2 is a 1.5B parameter Transformer Decoder trained on textual data. Below is a visualization of the entire pipeline:
 |
|---|
| ViT encoder + GPT-2 decoder. ViT takes in a sequence of image patches and outputs contextualized patch embeddings. GPT-2 takes those patch embeddings and autoregressively generates a caption. |
I will only focus on the ViT encoder in this post. ViT takes in a sequence of patches extracted from an image and outputs contextualized patch embeddings \(E_1, \cdots, E_N\); an example of image patches from a Pokémon card of Donphan can be found in the above figure. These contexualized patch embeddings will be important for understanding the representation space of ViT. For additional information about the ViT + GPT-2 model, please see my previous report under section Model Description.
Model Training
I trained the full model (ViT + GPT-2) on the full 13K dataset for 10 epochs with a batch size of 16 and learning rate of 1e-3.
These hyperparameters were based on intuition; I did not run a hyperparameter search as I am training on my small, personal laptop (a single run on my M2 Macbook Air with 24GB RAM took ~2 days to complete).
The script used to train the model can be found in the project’s Github repo under train_full.py and the trained model can be found in the Weights and Biases project.
Pokémon Cards Dataset
The original Pokémon Cards dataset can be found on HuggingFace and consists of 13,139 cards from 147 card sets, with the most recent set being Silver Tempest (See the Bulbapedia article List of Pokémon Trading Card Game expansions for the list of all English Pokémon sets). This means that this dataset does not include Pokémon from the most recent mainline Pokémon games, Scarlet and Violet. This is important to know as the captioning model we will train in this post will not work well on Pokémon from the most recent games.
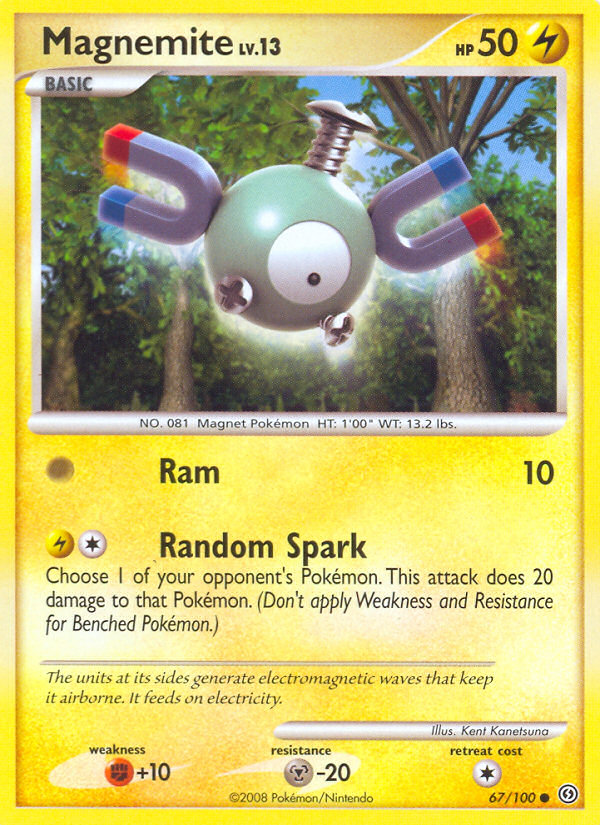
In the previous post, I had noted that the dataset contained blank cards. Here, a blank card is denoted by the back of a Pokémon card:
| A blank card in the Pokémon dataset (back of a Pokémon card) |
While the original dataset contains 13K cards, 51 of those cards are blank.
Given there are 13K cards, I could either (1) manually comb the entire 13K set of cards and remove the blank cards, or (2) do something less painful.
As such, to check for blank cards, I took the above card, passed it through the pretrained ViT encoder, and retrieved the [CLS] embedding from the model’s final layer.
This gave me a vector representation of the card.
I then computed the cosine similarity between this embedding and all the [CLS] embeddings from all other cards.
Those whose cosine similarity was greater than 0.95 were discarded.
There are definitely other ways to prune blank cards, but this is what I ended up doing.
For example, it is possible to simply compare each card pixel-by-pixel, but this does not work well when two cards have different dimensions.
Once the dataset was cleaned up, I grouped the dataset by set_name and split 80% training, 10% validation, and 10% evaluation; this was the same as my previous report.
An interactive table containing the dataset can be found in my Weights and Biases project.
What does ViT Learn?
I wanted to understand the representation space that the ViT encoder learns during fine-tuning so I can determine future research and development directions.
I did this by visualising and studying clusterings of the embeddings generated by ViT over the validation dataset.
I opted to not use the evaluation dataset as I did not want to peek at the dataset and bias any future extensions.
I also focused on the ViT encoder because that has a direct influence on the generated captions; without a good image representation, a model will fail to generate good captions.
The notebook used to generate the below visualizations can be found in the project’s Github repo under visualize.ipynb.
To visualize the representation space of ViT, I began by generating image embeddings for each Pokémon card as follows. For each card in the validation dataset, I used the trained ViT model to extract contextualized embeddings for each image patch of the card and averaged the embeddings. I considered using the output of the [CLS] token as the image embedding, but initial experiments showed that it did not cluster well. I suspect this is because the token was not directly trained during fine-tuning and thus did not learn an image representation.
Once image embeddings were generated for all cards in the validation dataset, I clustered the cards using \(k\)-medoids. \(k\)-medoids is similar to that of \(k\)-means, but has the additional benefit of (1) being robust to outliers and noise, and (2) using a data point as the centroid of a cluster instead of an average over the cluster’s data points. This latter point is important as it allows me to understand what each cluster contains.
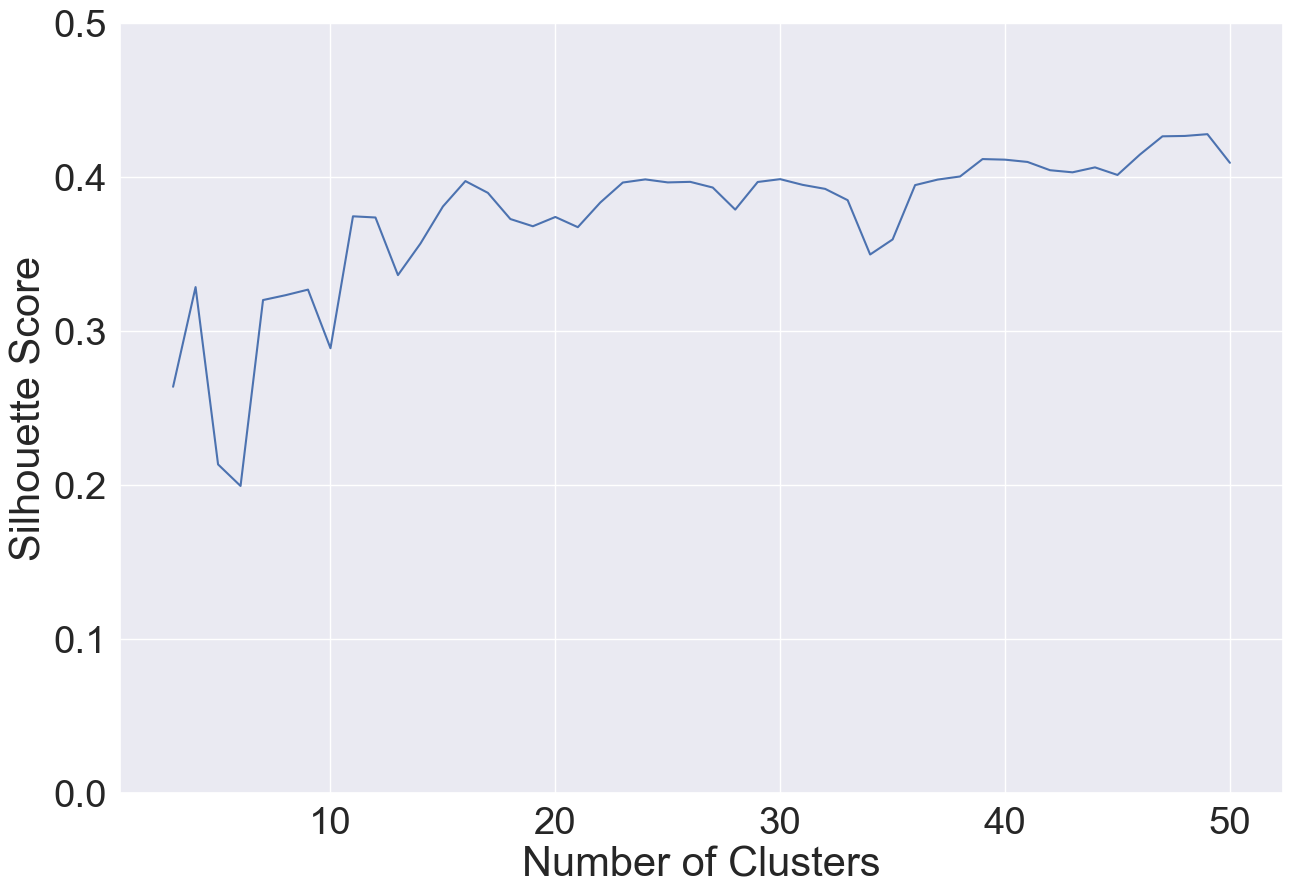
To find a good number of clusters for \(k\)-medoids, I varied the number of clusters \(k\) between 3 and 50 and computed their silhouette coefficient/score. The silhouette score measures how similar data points are to their own cluster as compared to other clusters. The silhouette score ranges from -1 to 1, where 1 indicates that a data point is closer to its own cluster than others and -1 indicates that the data point is closer to another cluster than its own. Thus, higher silhouette scores are better. I then use the elbow method over the silhouette scores to find the best number of clusters. Below is a plot containing the silhouette score for 3 to 50 clusters:
 |
|---|
| Number of Clusters vs. Silhouette Score |
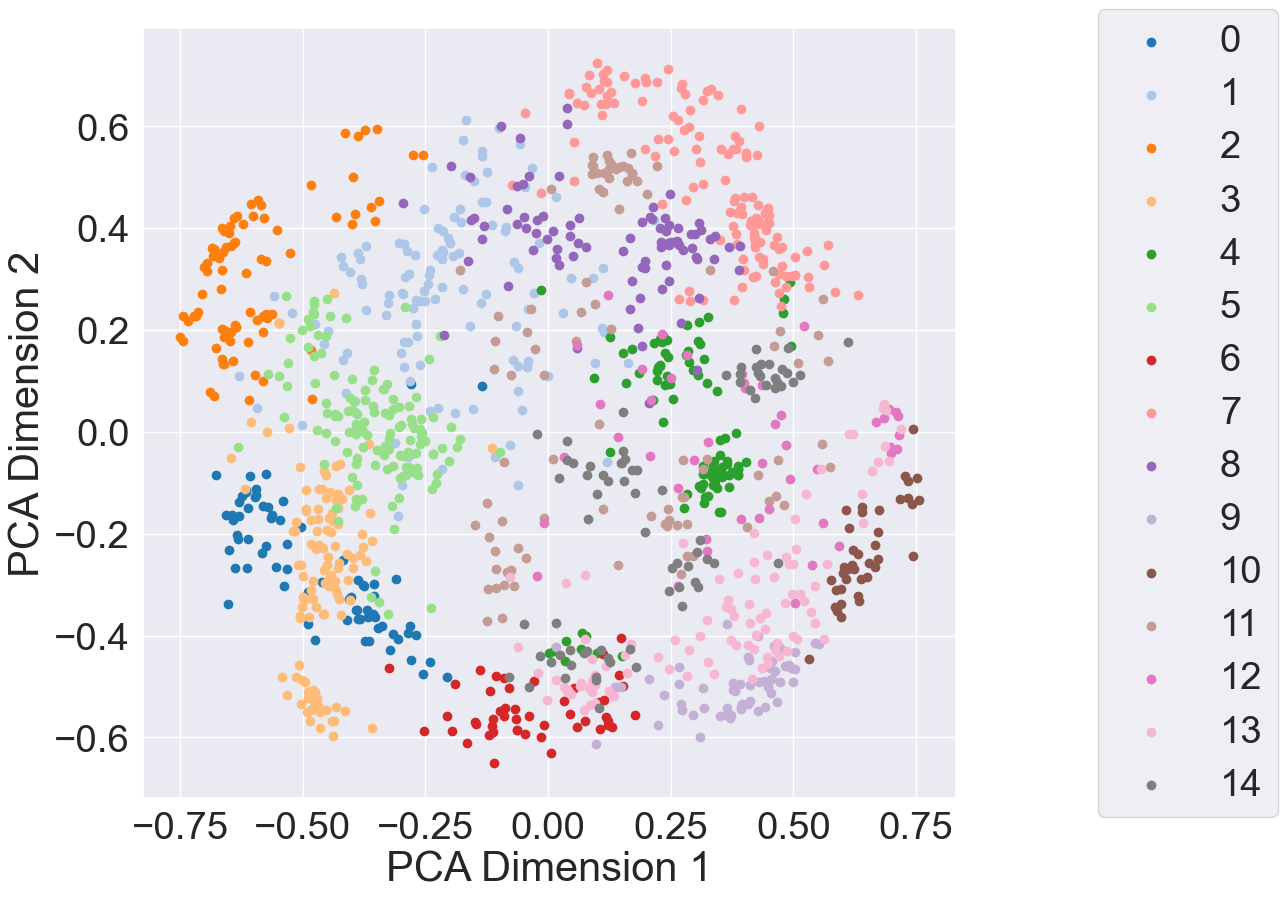
According to the above plot, the elbow occurs around 15 (silhouette score of 0.381). Given this, I visualized the \(k\)-medoids clusters with \(k=15\), projecting the Pokémon card embeddings using Principle Component Analysis (PCA):
 |
|---|
| PCA projection of Pokémon card embeddings with \(k=15\) clusters |
The first positive thing we see is that ViT is partitioning the representation space! More specifically, we see that the clusters seem to be mostly separate (e.g., data points in clusters 0, 6 and 10 are close together). Recall that \(k\)-medoids uses data points as the actual centroids of each cluster. This means that we have some information as to what each cluster represents. Below are the cards representing each of the cluster centroids:
 |
 |
 |
|---|---|---|
| Centroid 0 | Centroid 1 | Centroid 2 |
 |
 |
 |
| Centroid 3 | Centroid 4 | Centroid 5 |
 |
 |
 |
| Centroid 6 | Centroid 7 | Centroid 8 |
 |
 |
 |
| Centroid 9 | Centroid 10 | Centroid 11 |
 |
 |
 |
| Centroid 12 | Centroid 13 | Centroid 14 |
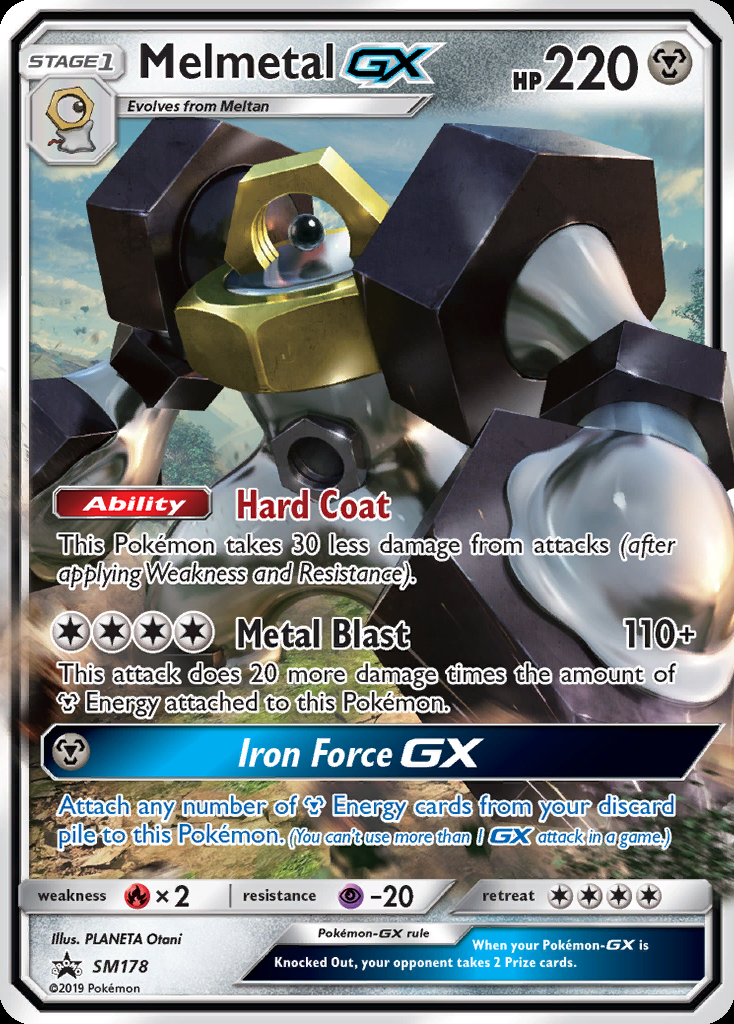
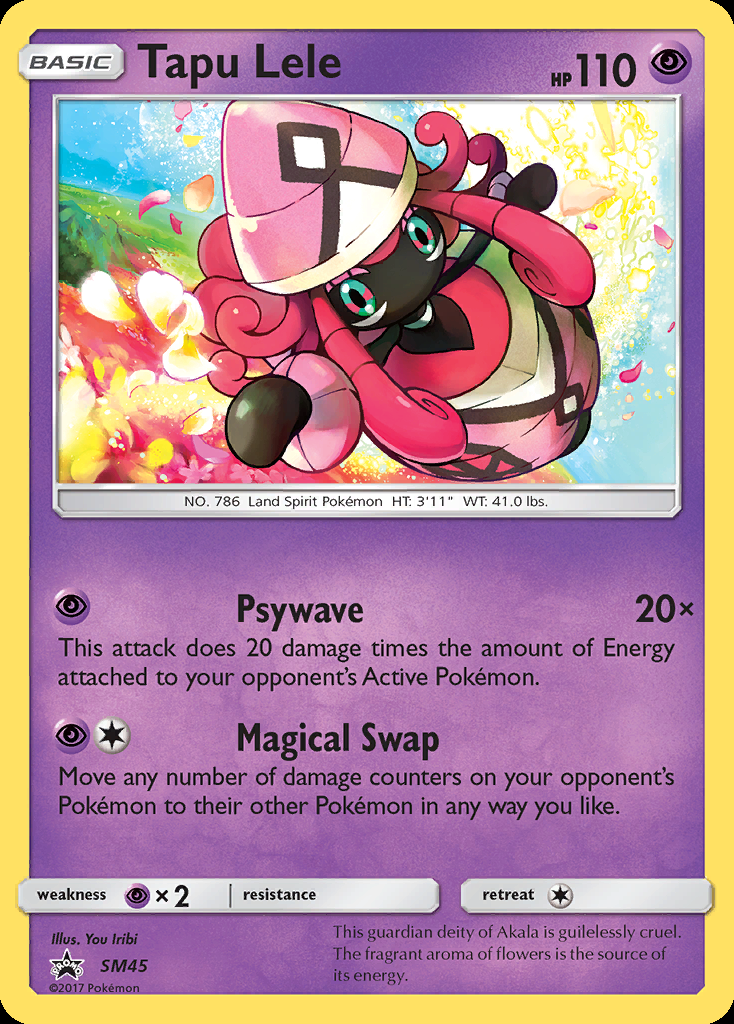
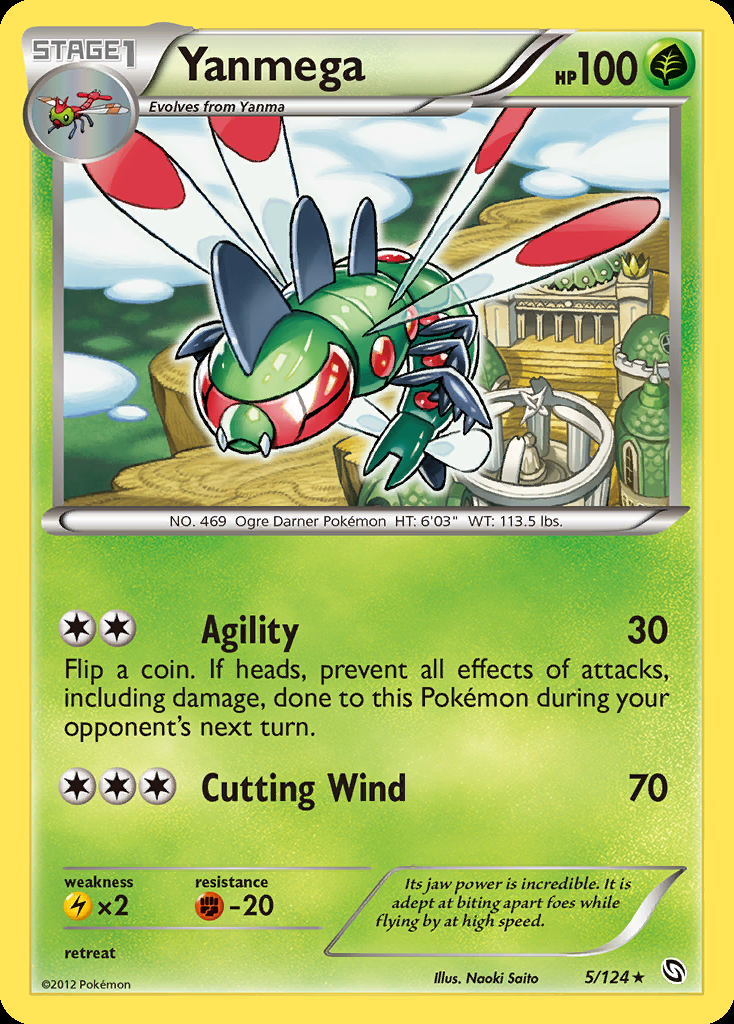
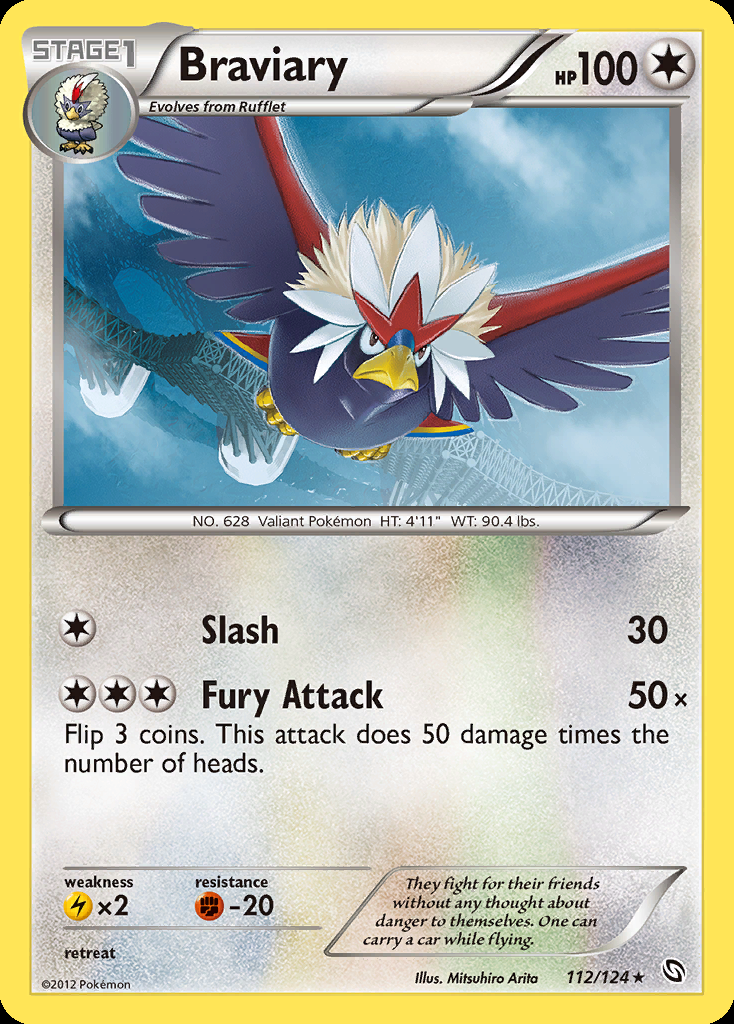
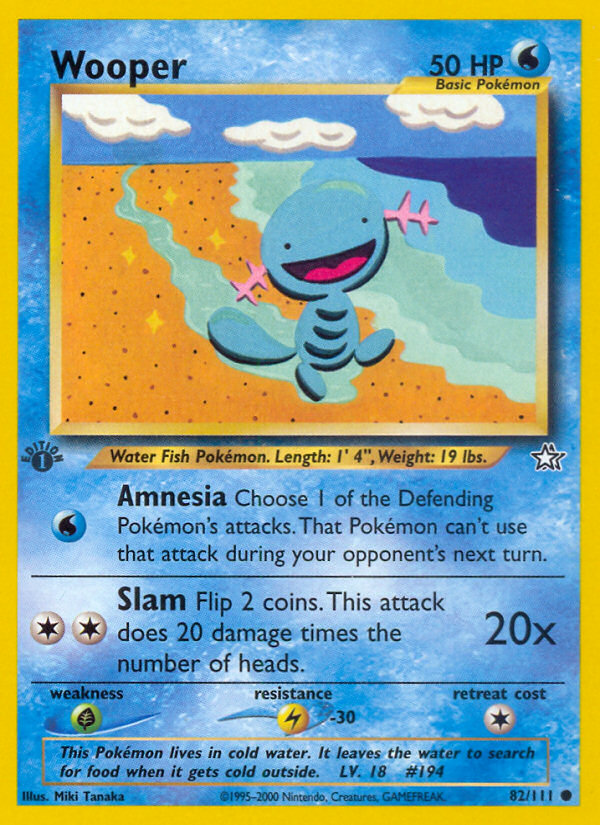
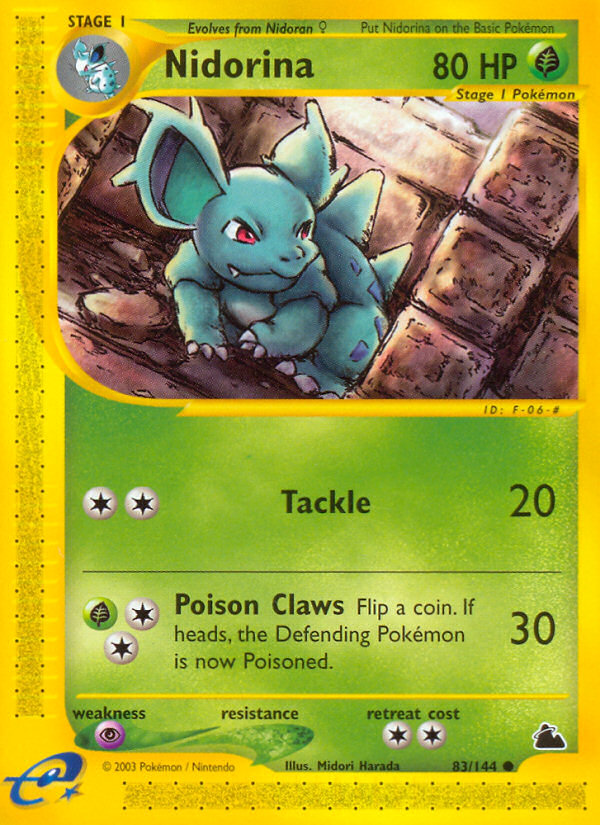
At a glance, the centroids consist of different Pokémon types and print variations between the cards. Here, I define print variation as differences in how the card is printed. For example, the Frillish and Wooper cards above have different frames surrounding them, different shades of blue, and different fonts. There are 11 Pokémon types in the validation dataset: Fairy, Colorless, Psychic, Fire, Water, Metal, Fighting, Grass, Darkness, Dragon, and Lightning; 9 out of 11 Pokémon type are represented in the centroids, the ones missing being Fairy and Dragon. The print variations are between Psychic (centroids 0 & 2), Water (centroids 3 & 6), Grass (centroids 9 & 10), Fighting (centroids 7 & 13), and Darkness (centroids 8 & 12).
These results imply that ViT is able to separate out different Pokémon types, but is sensitive to print variations. The Pokémon type is associated directly with the Pokémon on the card; thus, if we know the type, we can pinpoint the Pokémon. For example, if I know the card contains a fire-type Pokémon, then that narrows down what Pokémon could be on the card (i.e., it is impossible for the Pokémon to be a Pikachu). Accurately predicting the Pokémon name in a caption is very important as that is the most important part of the caption. However, the print variation is irrelevant for captioning the card and thus we want ViT to be insensitive to this. This is one avenue for future work.
Out of curiosity, I looked into how the representation space looks if I clustered by Pokémon type. Below is a plot of the Pokémon card embeddings clustered based on Pokémon type and projected using PCA:
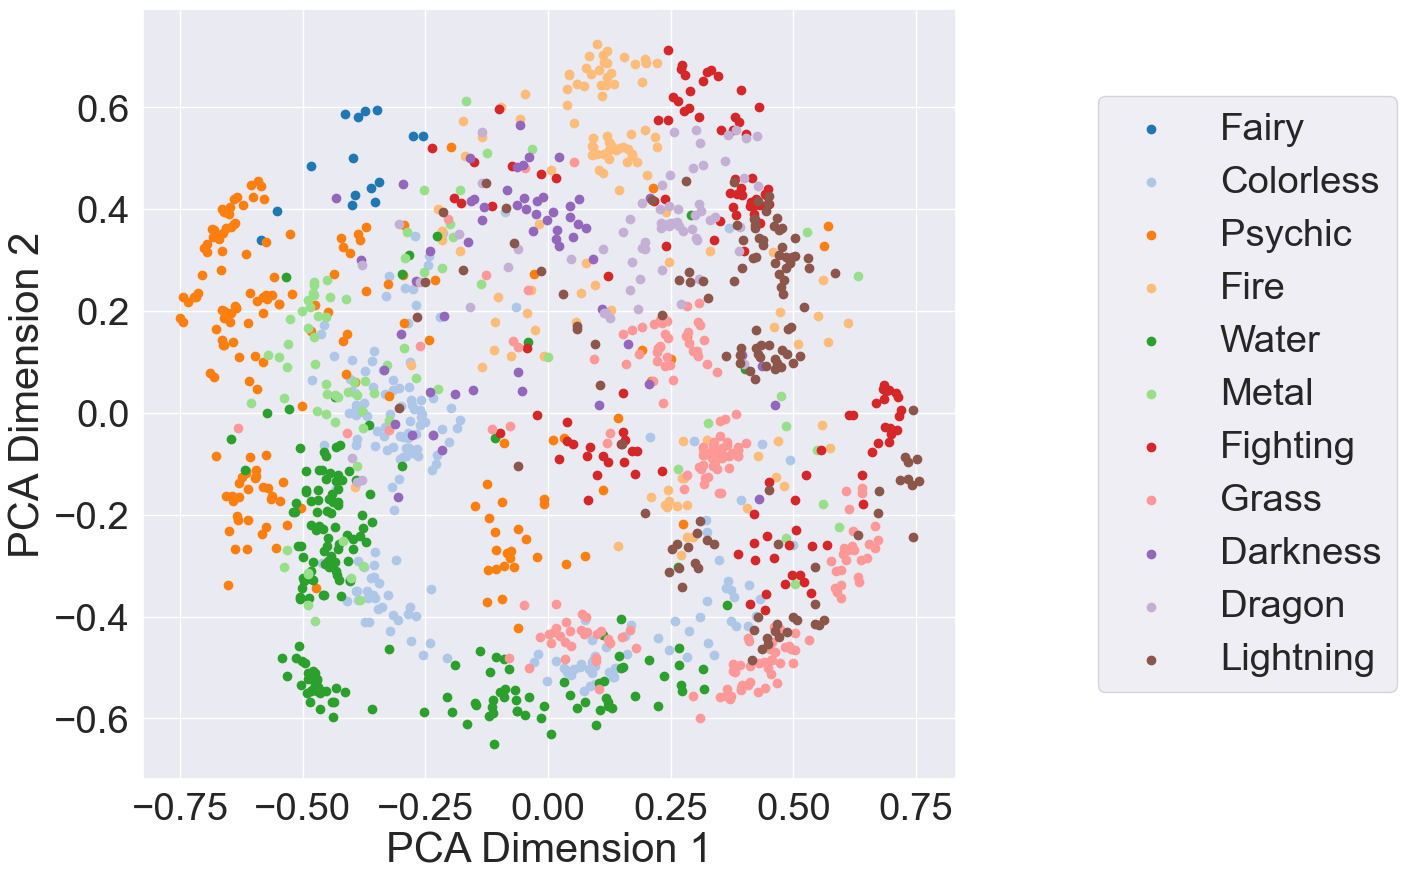 |
|---|
| PCA projection of Pokémon card embeddings clustered by Pokémon type |
From a visual inspection, it seems that ViT is able to distinguish Pokémon types. However, this clustering has a silhouette score of 0.141. To see if there was poor clustering over all Pokémon types, I computed the silhouette score for each type. My results show that Psychic, Metal, Lightning, Fire, and Fighting had silhouette scores below 0.10; the types that performed the best were Fairy (0.737, 15 samples in the dataset) Water (0.384, 181 samples), and Darkness (0.341, 59 samples). I suspect this score would improve with better training and a hyperparameter search; another avenue of future work.
Conclusions
In this blog post, I extended a prior project that fine-tuned a vision-language model to caption Pokémon cards and provided an initial study on the representation space of the ViT encoder. These results indicate that the ViT encoder can separate out different Pokémon types, but is sensitive to print variations. Having the ViT encoder learn a good representation of the Pokémon cards is important as it directly affects the generated captions.
There are two next steps I’m taking with this work. The first step is to extend model training to be insensitive to print variations. The second step is to do a hyperparameter search to see if better hyperparameters would improve cluster separation.